
Welcome to the TIG Stack Demonstration Website
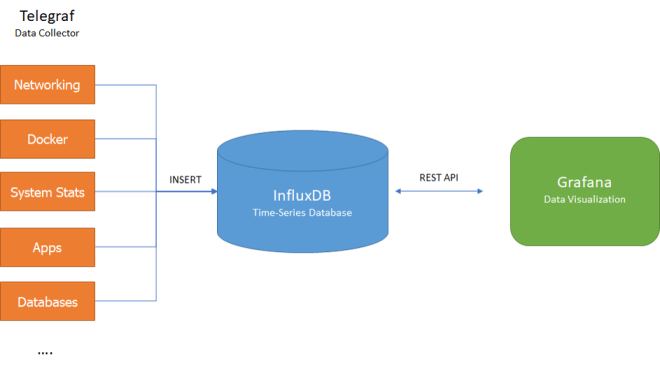
TIG stands for Telegraf, InfluxDB and Grafana - the key elements of generating dynamic and engaging data/sensor dashboards.
Below are links to some example Grafana dashboards showing different metrics.
Some of the dashboards are running on the Google Cloud Platform (GCP). A couple are in a domestic setting running on the infamous and humble, £35 Raspberry Pi.
All three use the container orchestration software Docker running separate containers with the following open source software. Please click on the software name for further information (opens in a new window).
Please use the links below to view the Grafana dashboard demo pages.
For security you will need to contact us for the login details: Tel: 08453 751781 or E-Mail: This email address is being protected from spambots. You need JavaScript enabled to view it.
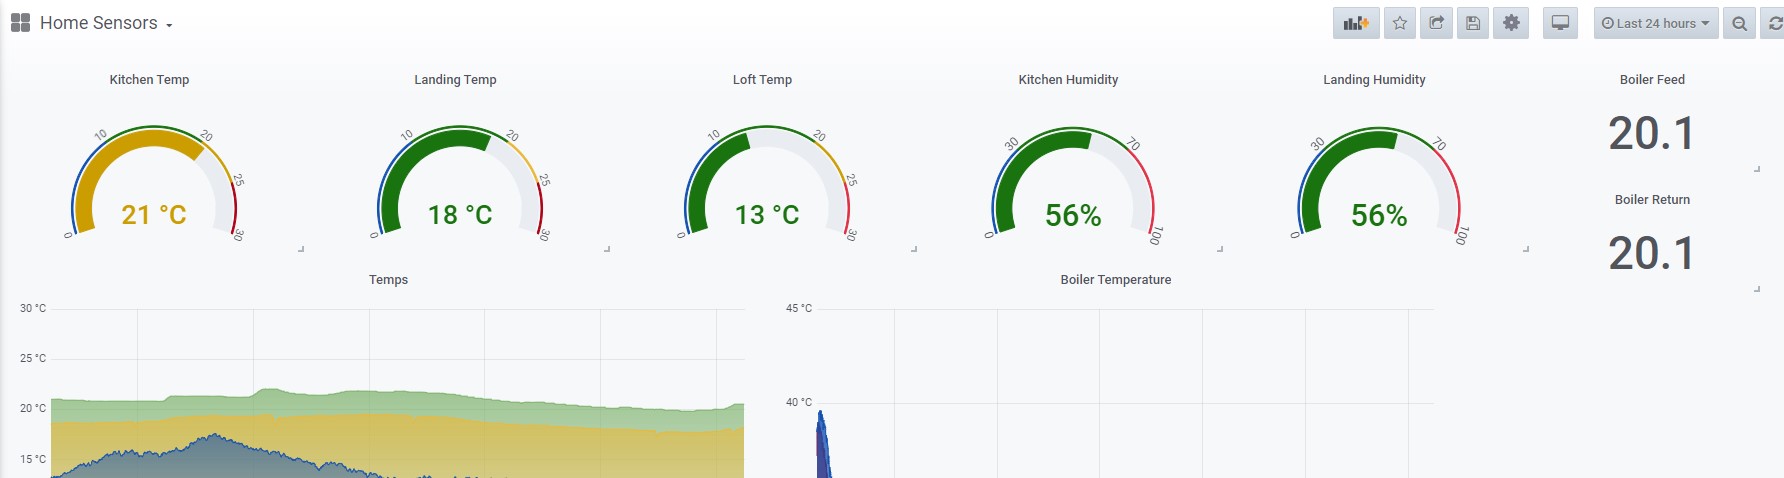
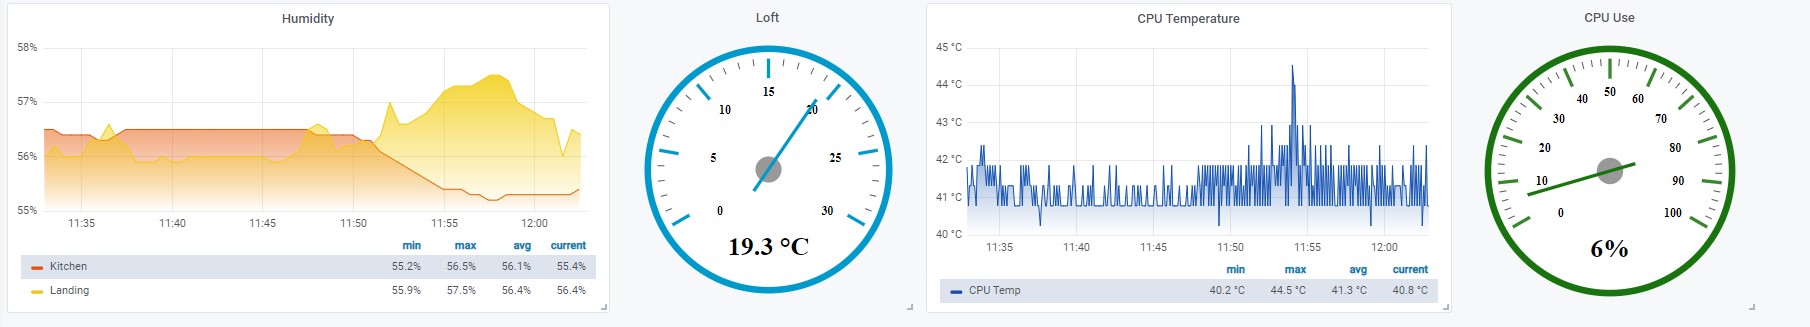
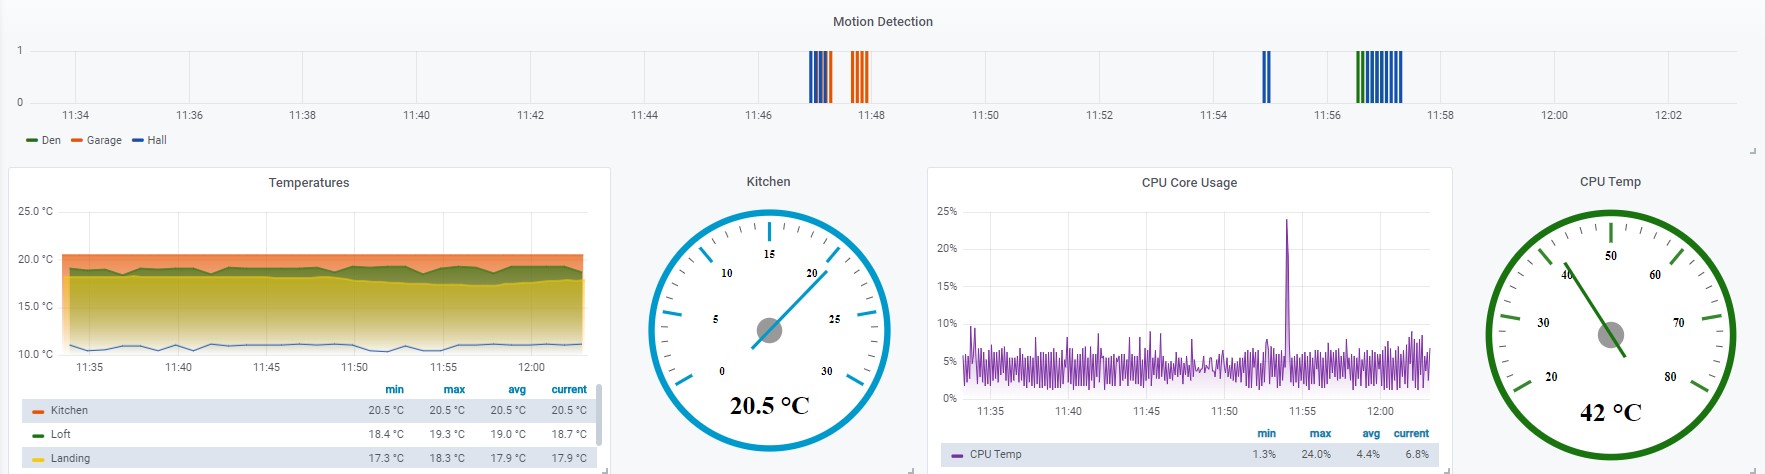
Raspberry Pie Domestic Dashboard
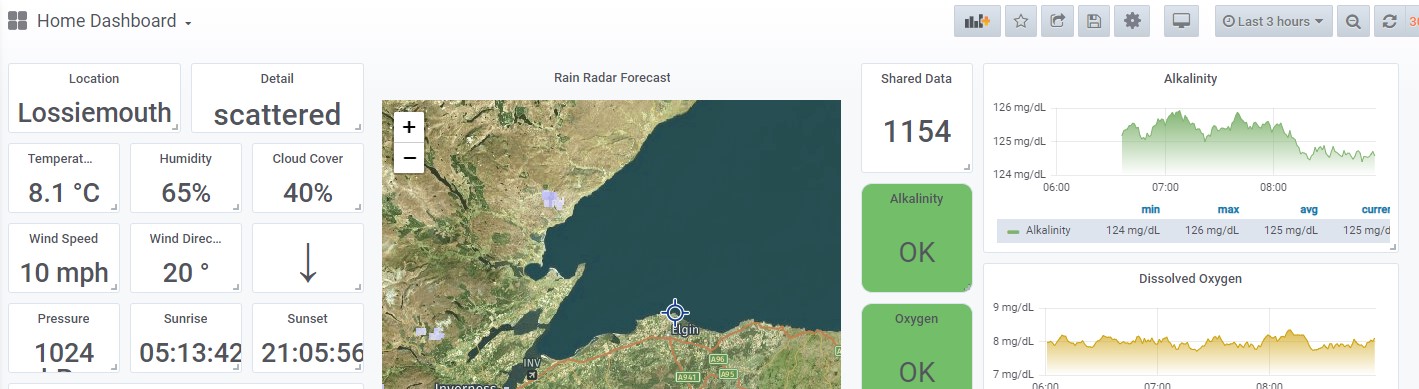
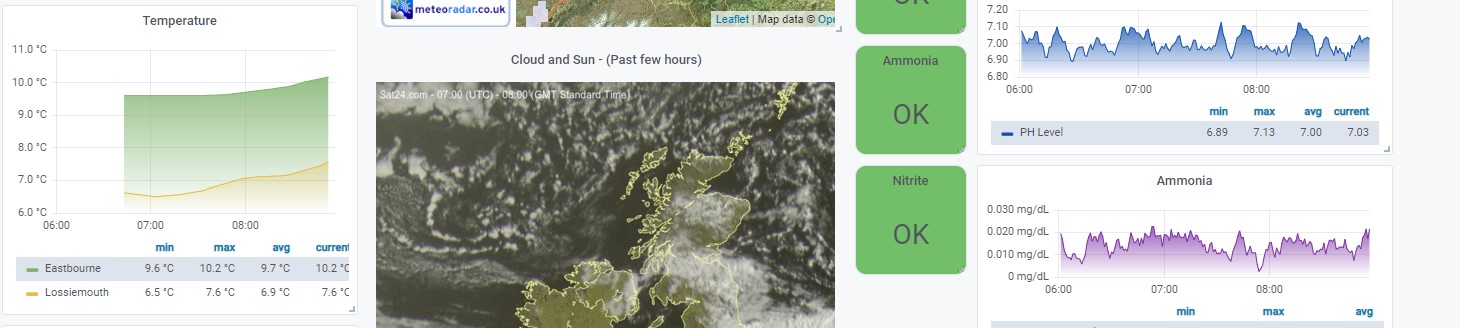
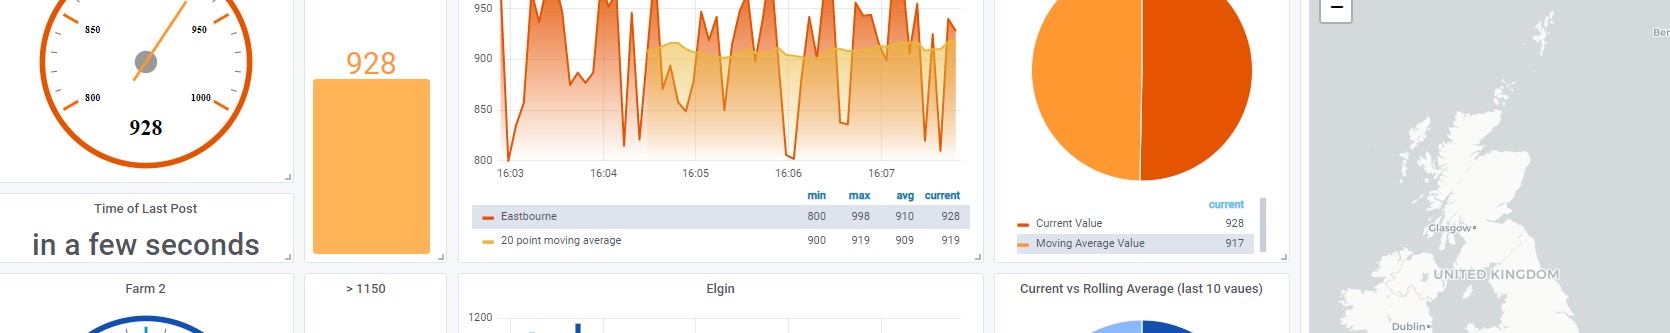
Raspberry Pi Hosted Open Weather Demo Dashboard
Covid 19 Dashboard (hosted on AWS)
The other pages on this site provide further reading about the "how" and some links to real case studies where companies have used this methodology to enhance their business.
For further details or to have a personal demonstration please get in touch with us at Viable Ventures Ltd.
Tel: 08453 751781
E-Mail: This email address is being protected from spambots. You need JavaScript enabled to view it.
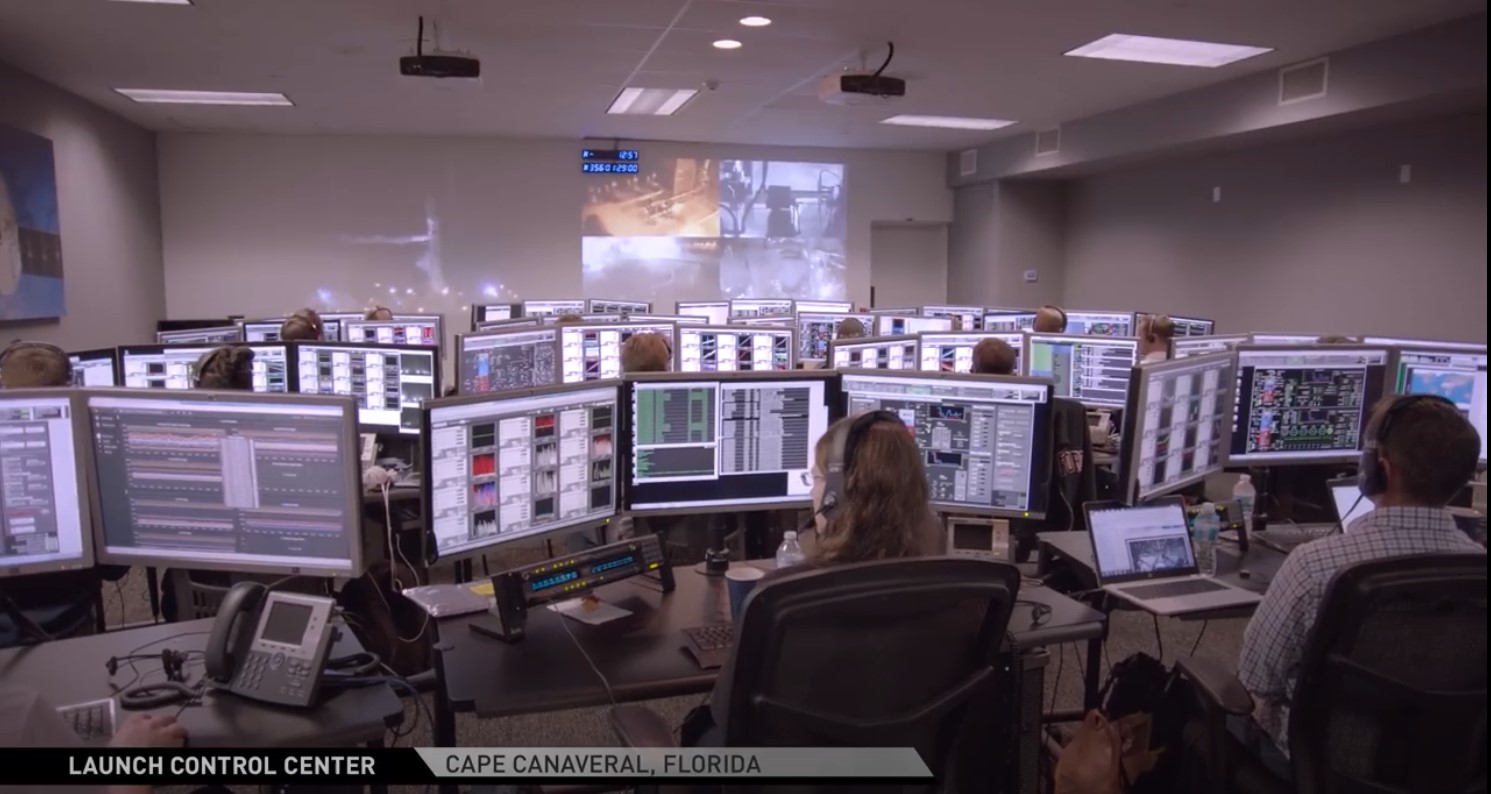
By the way, if it's good enough for Elon and the SpaceX team to monitor their rocket launches,
chances are it will do a good job of telling you how windy it is in the Shetlands, or anything else you want to monitor in realtime.