Data Flow
A brief description of the data flow - from sensor to web based dashboard.
Sensors
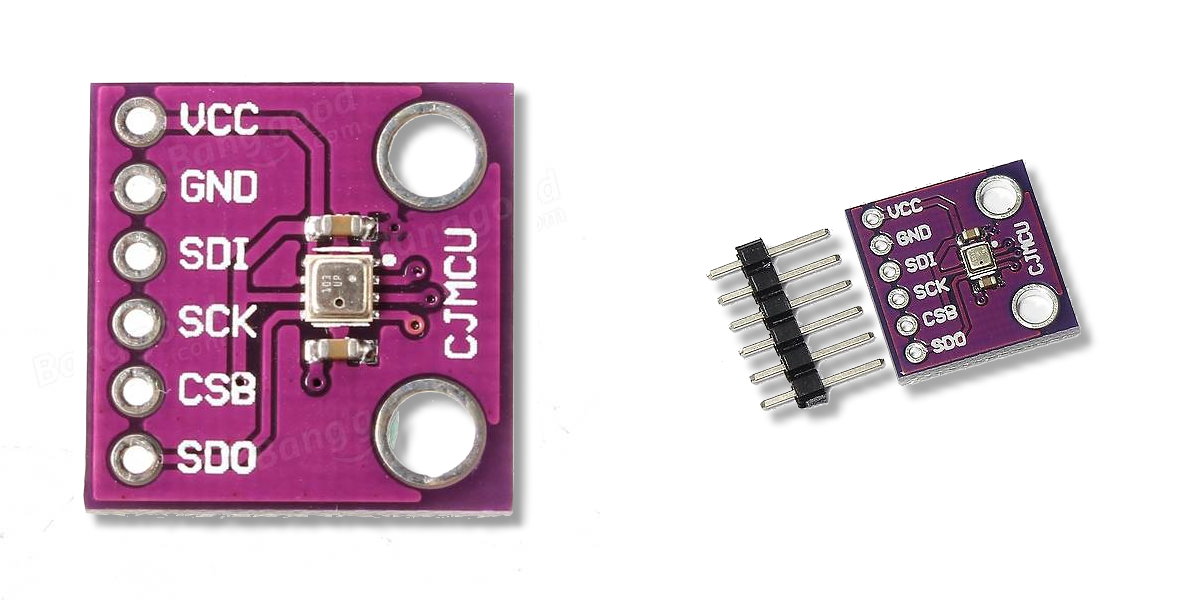
An example sensor above - the BME280. Measuring relative humidity, barometric pressure and ambient temperature which can send data to a Mosquitto (MQTT) server. Sensors come in all flavours depending on end use. In this demo, data is collected from different physical sensors types deployed in real world scenarios, along with data from the OpenWeather API and even some random number generators to simulate some graphical outputs.
Mosquitto (MQTT)
MQTT stands for MQ Telemetry Transport. It is a publish/subscribe, extremely simple and lightweight messaging protocol, designed for constrained devices and low-bandwidth, high-latency or unreliable networks. The design principles are to minimise network bandwidth and device resource requirements whilst also attempting to ensure reliability and some degree of assurance of delivery. These principles also turn out to make the protocol ideal of the emerging “machine-to-machine” (M2M) or “Internet of Things” world of connected devices, and for mobile applications where bandwidth and battery power are at a premium.
Node Red
Node-RED is a programming tool for wiring together hardware devices, APIs and online services in new and interesting ways. It provides a browser-based editor that makes it easy to wire together flows using the wide range of nodes in the palette that can be deployed to its runtime in a single-click.
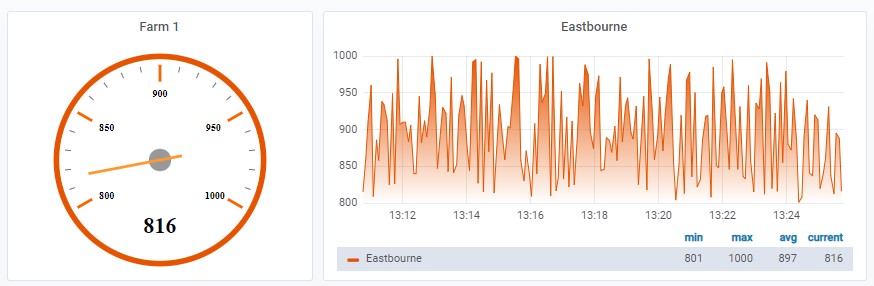
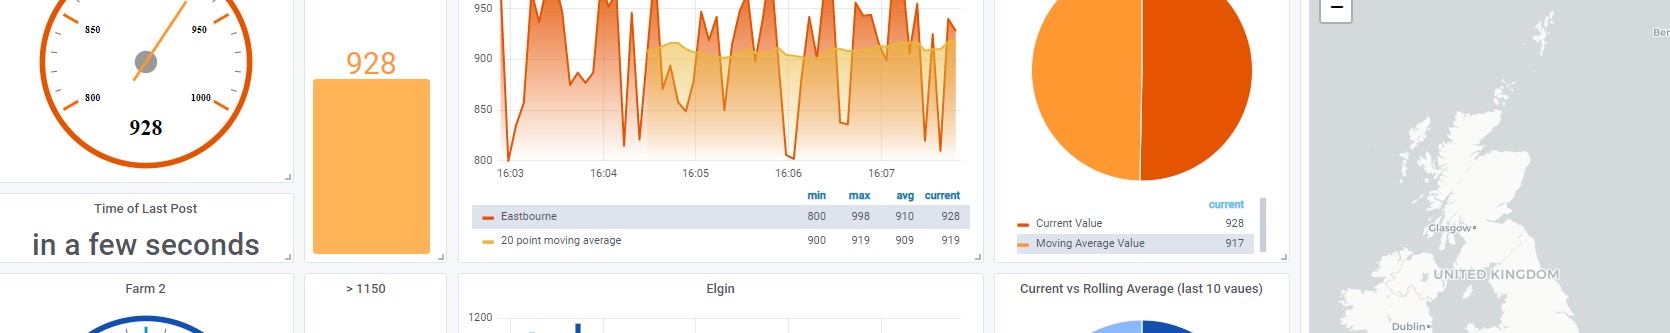
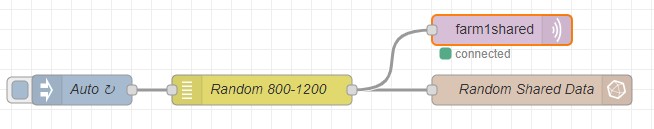
For example the flow below generates a random number every 5 seconds between 800 and 1200. This value is then published in the topic "farm1shared" and also injected as a value in an Influx database.
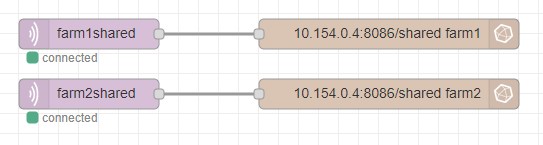
Now the value of "farm1shared" is taken from MQTT and injected into another Influx database on the Corporate site. This shared data remains seperate from the data on the rest of the original site, thus protecting it's private metrics.
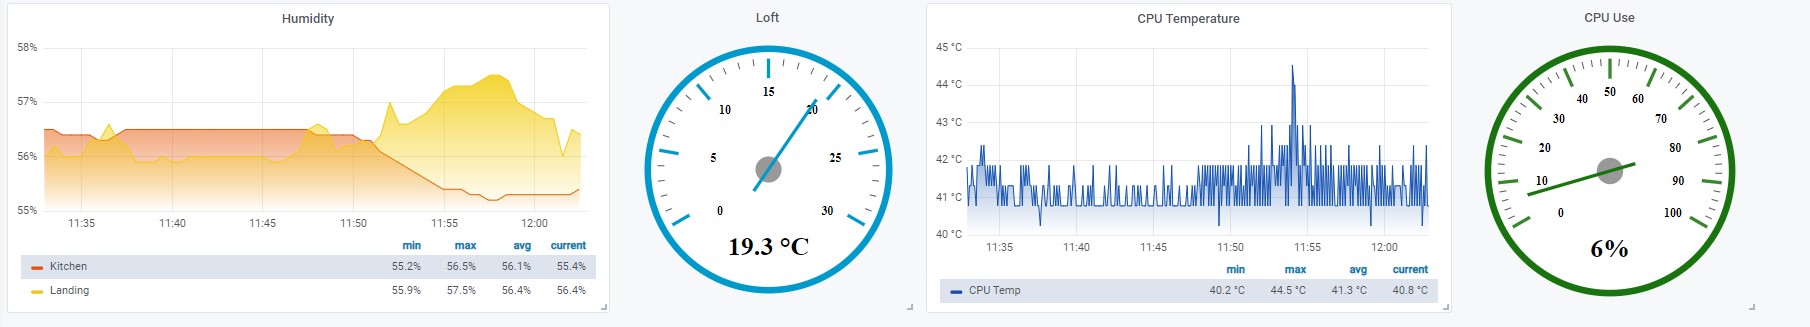
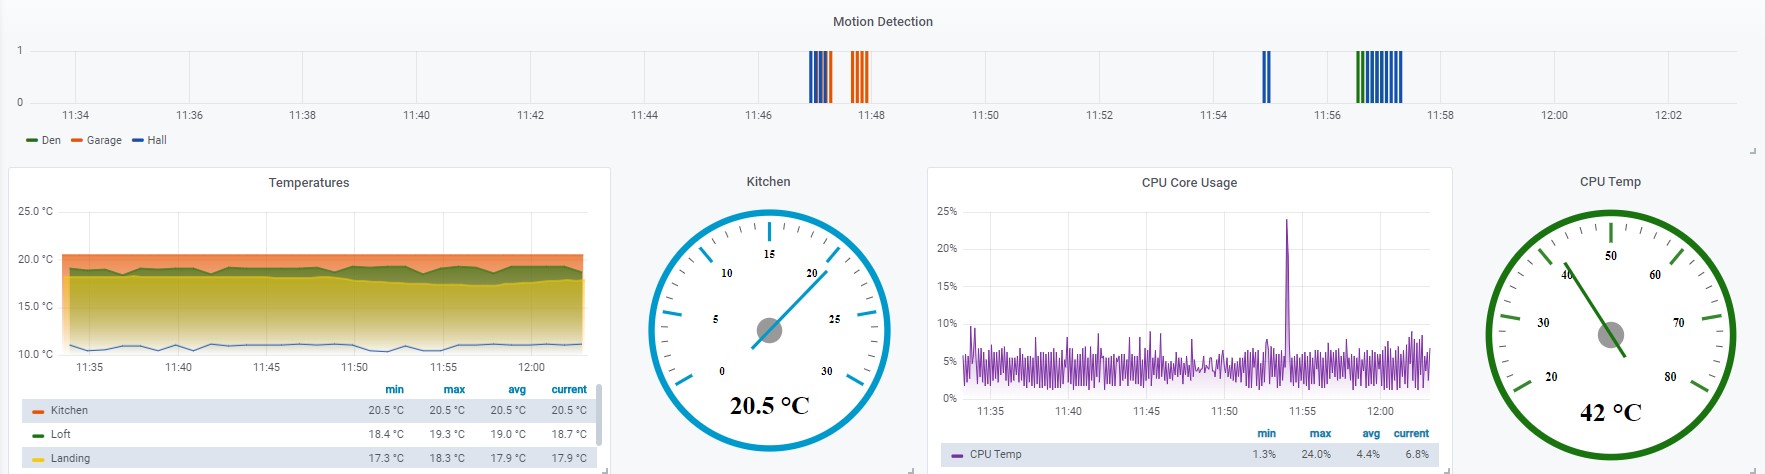
Grafana
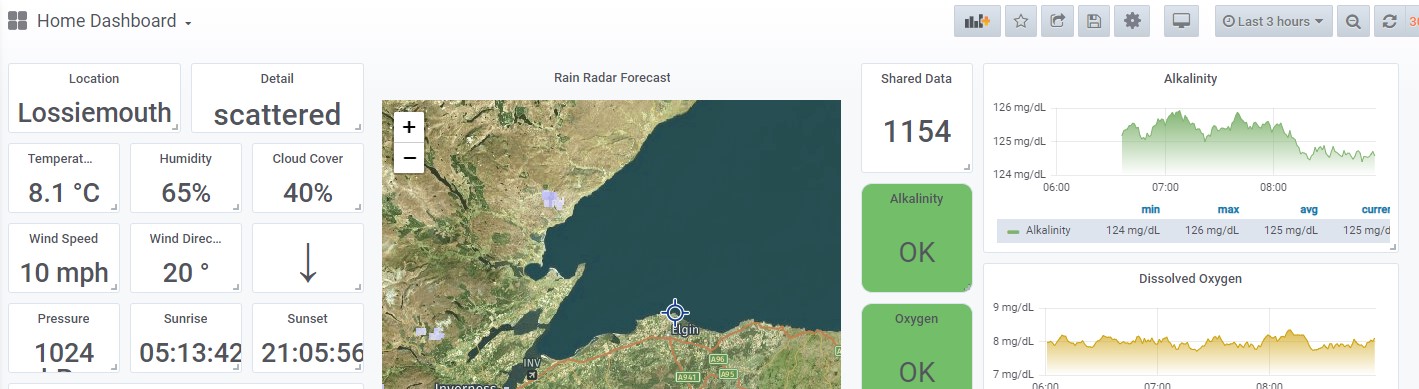
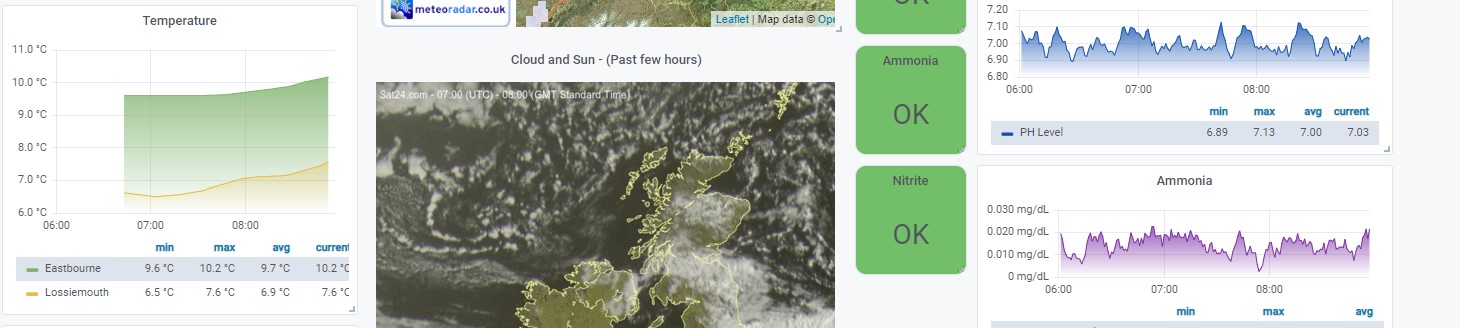
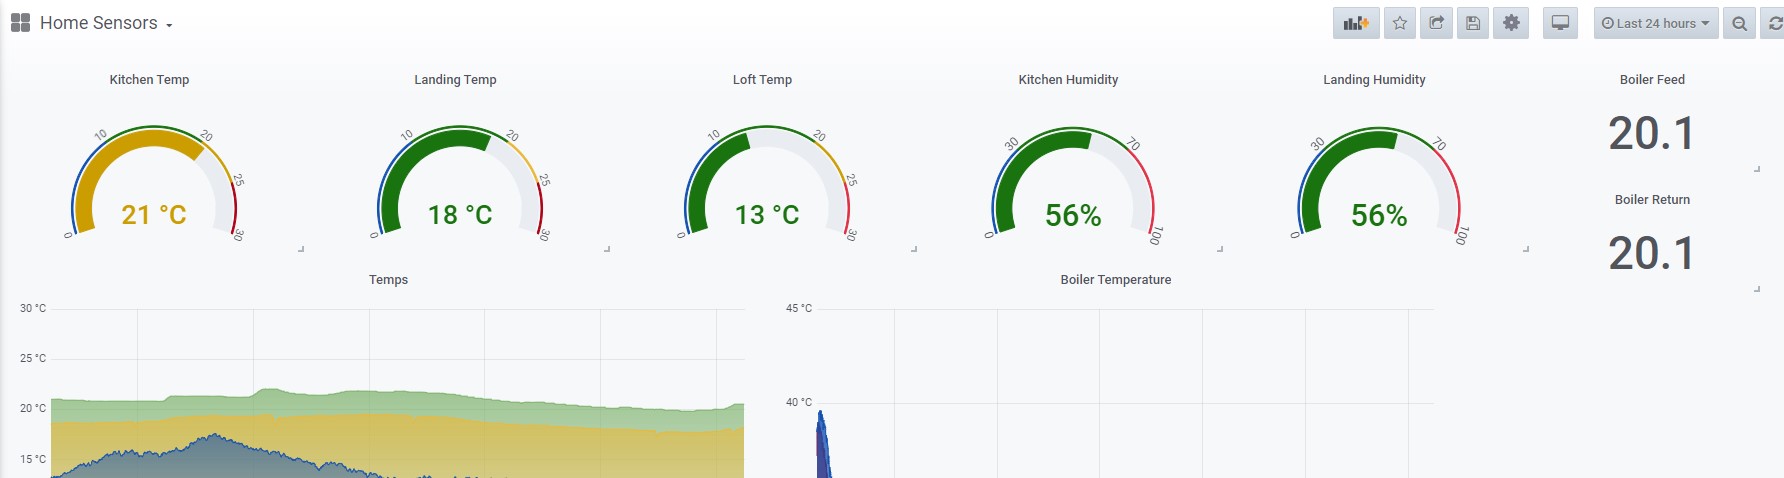
The database above becomes a data source in Grafana and the values can then be referenced and displayed as part of the Corporate HQ dashboard system.
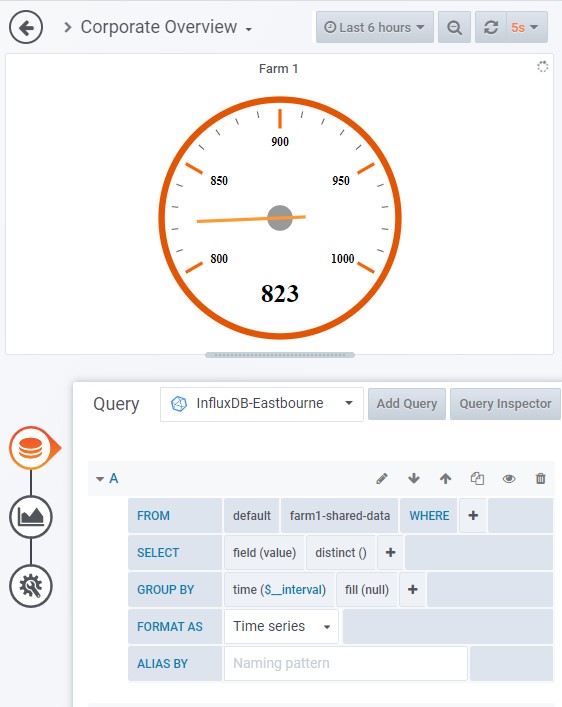
There are numerous ways to display the data; text, gauges, graphs, charts, etc and all dynamic. There are many third party plugins available to cover every type of display requirement. Further details and examples are here.